Embedded Analytics with LoginID Dashboard
The LoginID Dashboard provides real-time and historical visibility into user activity, passkey performance, and system-level interactions. It helps you monitor and analyze passkey authentication and platform events across your application.
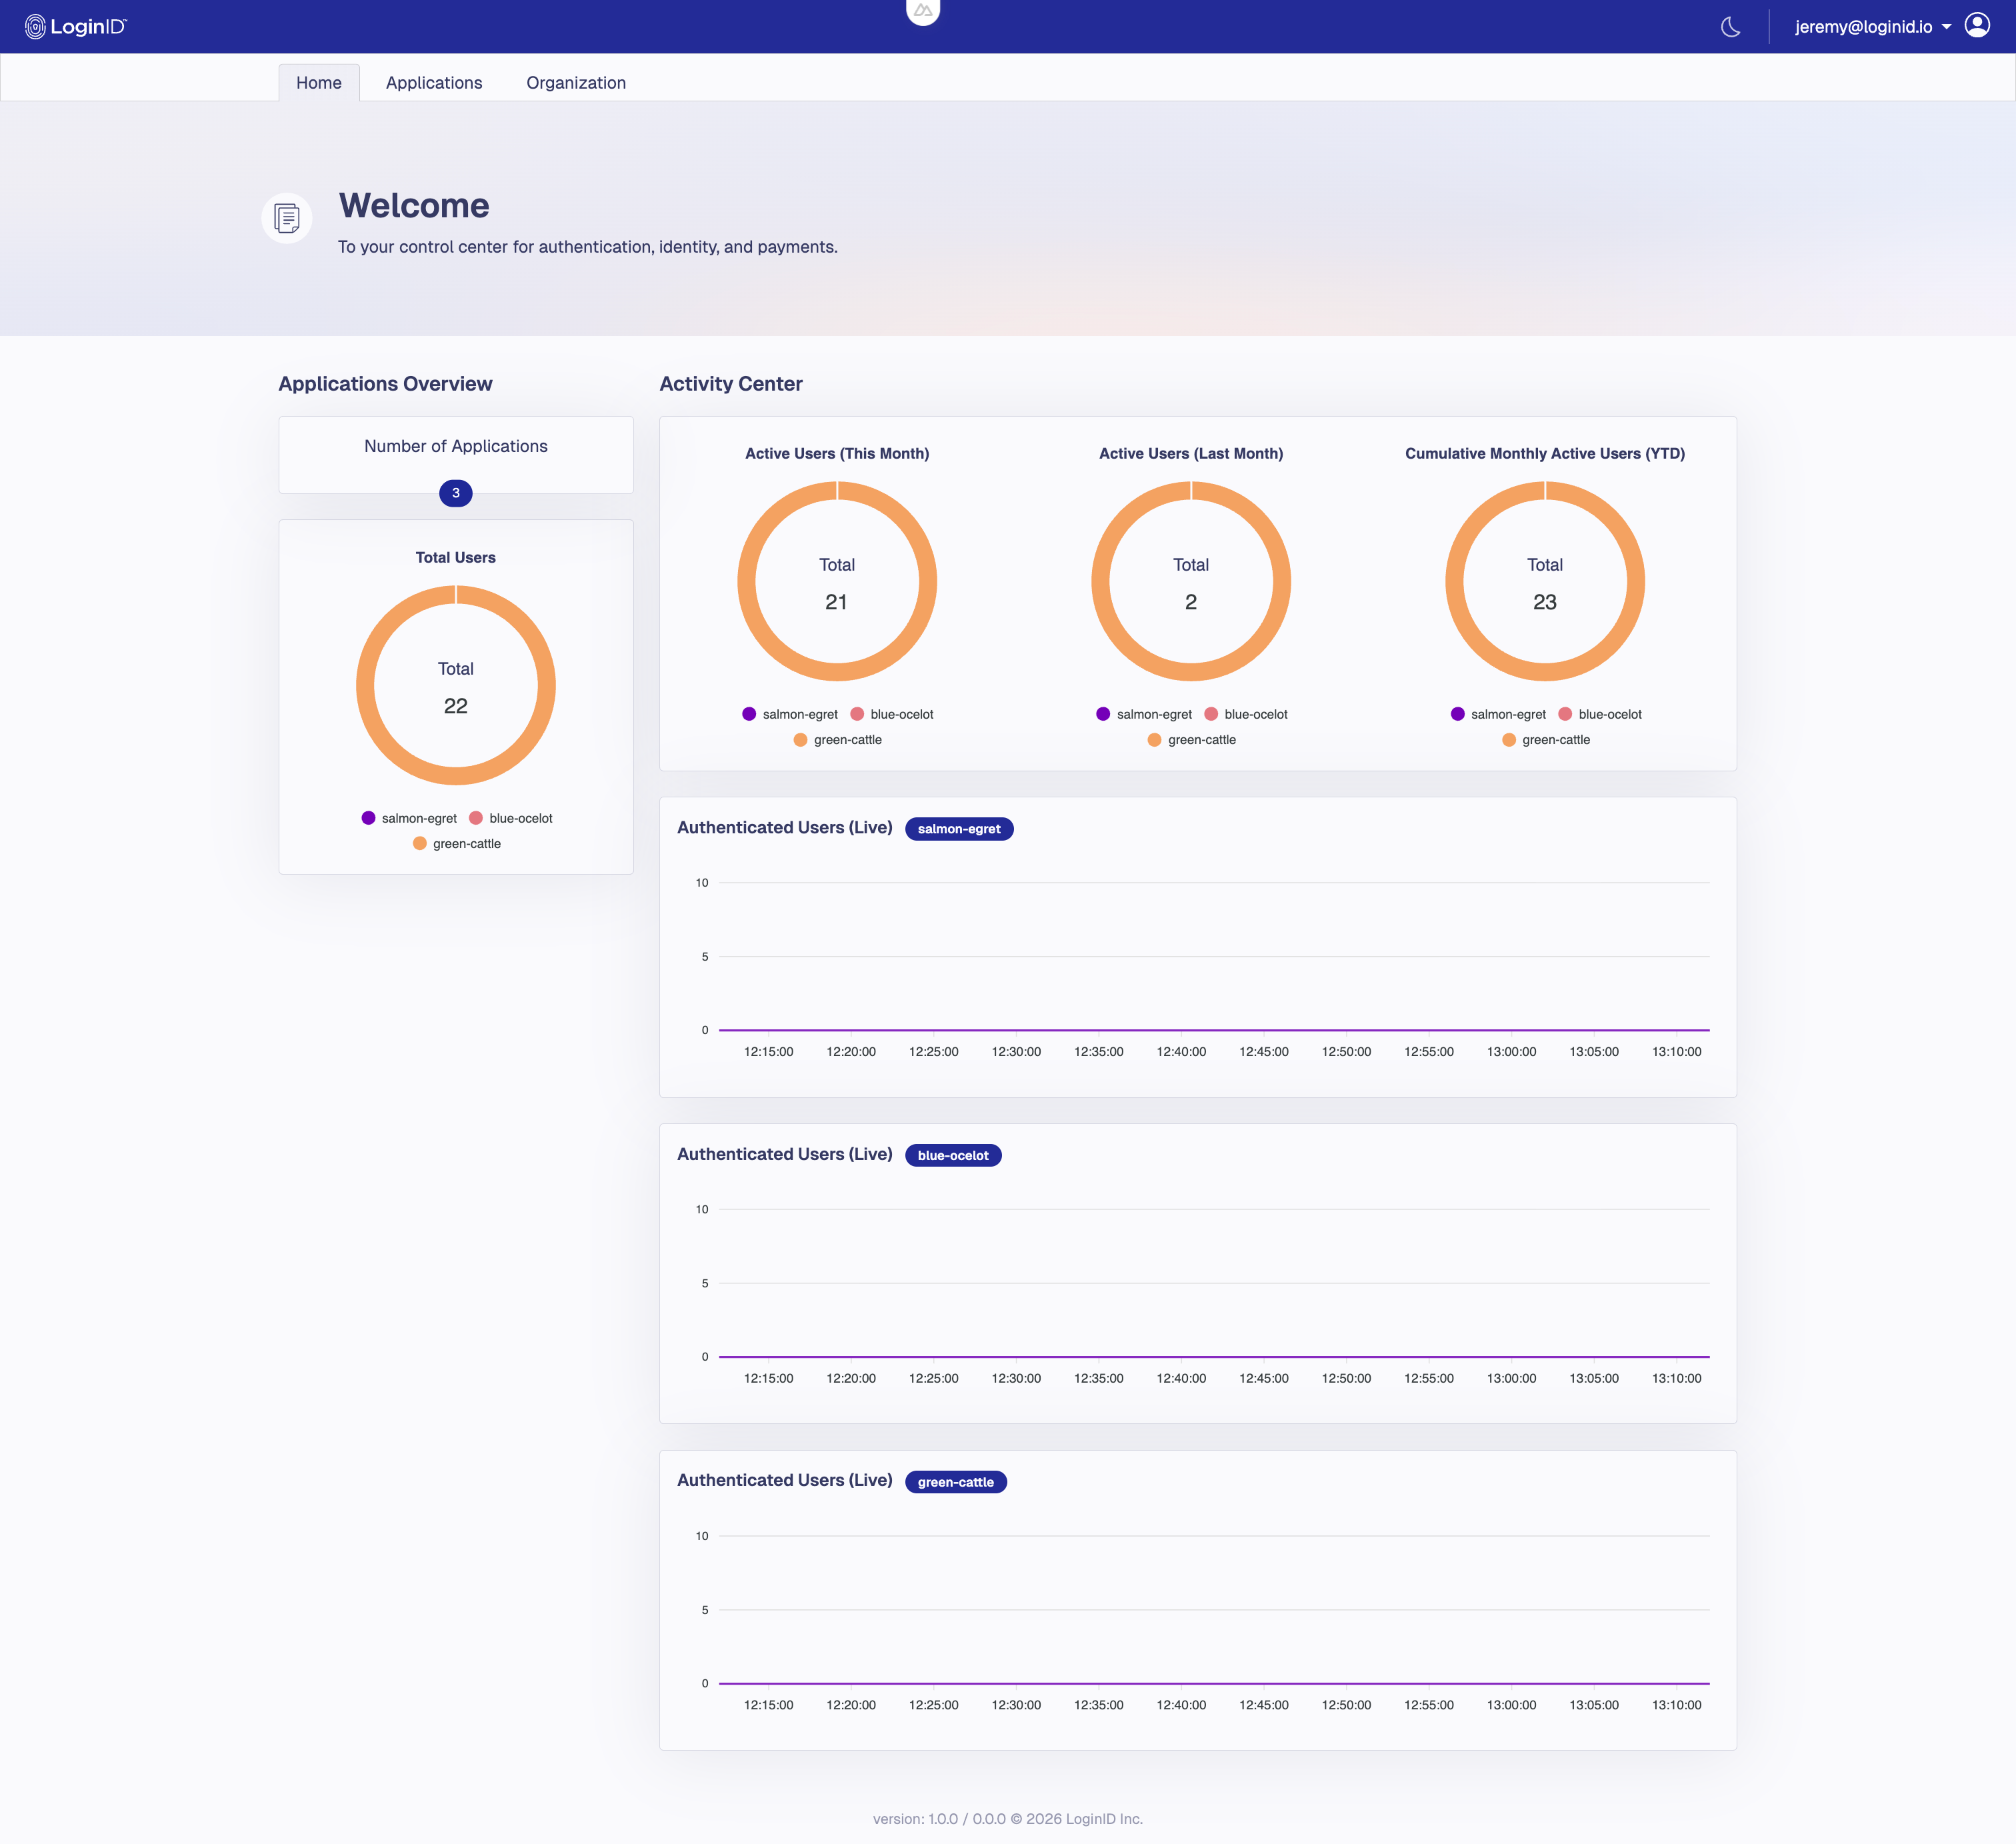
Applications Overview
Right after you sign in, the Dashboard Home page provides a consolidated view of all your applications so you can quickly scan activity before drilling into app‑specific pages.
- Number of Applications — Total applications in your organization.
- Total Users — Combined unique users across all apps, segmented by application for quick comparison.
- Activity Center — High‑level usage at a glance:
Active Users (This Month)Active Users (Last Month)Cumulative Monthly Active Users (YTD)— Each donut chart shows totals with a legend by application.
- Authenticated Users (Live) — Per‑application real‑time charts that update continuously to help you spot spikes or anomalies.
Total Users Enrolled
This counts the total number of unique end users who have successfully registered at least one passkey with your application.
- Each user is counted once, regardless of how many passkeys they’ve registered.
- Useful for tracking overall adoption of passkey-based login.

Actions Overview
This section provides a high-level summary of user actions such as passkey authentications, passkey registrations, and transactions. Each event is classified as either completed or failed.
- Passkey Authentications: Number of successful or failed login attempts using passkeys.
- Passkey Registrations: Number of successful or failed attempts when creating a passkey.
- Transactions: Total completed transaction confirmation flows and their success/failure status.
The Transactions metric is directly tied to LoginID's Secure Checkout flow.
Each time a user confirms a transaction — such as a payment — using a passkey, this counter will increment.
You can filter this section by time period using the dropdown.

Device Overview
Displays aggregate information about the types of devices users are authenticating from, broken down by:
- OS Name
- Client Name — Typically the name of the browser (e.g., Chrome, Safari) or the mobile platform (e.g., Android, iOS).
- Client Type — Typically categorized as browser or other depending on the source of the request.
This can help you identify trends in platforms.

Top Authenticators
Highlights top passkey authenticators to help monitor usage and adoption across your application.
You can switch between Registration and Authentication views using the dropdown menu.
Each row lists:
- Provider Name — The authenticator or password manager (e.g., Google Password Manager, iCloud Keychain).
- Count — Total passkey registrations or authentications completed using that provider.

Real-Time User Authentication (Live)
Visualizes real-time data of users who are actively authenticating. This chart is helpful for monitoring spikes or irregular activity patterns.

Aggregated Authentication Activity
This graph aggregates passkey authentication data over a selected date range. Use it to understand historical login trends and behavior changes before and after releases or changes.
- Granular Time-Series Aggregation: Authentication data is grouped over time intervals to provide a clear picture of usage patterns. The time granularity adjusts dynamically based on the selected date range.
- Export Options: Charts can be downloaded as PNG, SVG or CSV files for use in reports or presentations. Just click the hamburger icon tab in the chart toolbar to select your preferred format.
- Fixed Polling Interval: The graph auto-refreshes at a fixed rate based on the selected date range:
- Under 7 days: Refreshes every 300 seconds (5 minutes)
- 7 to 30 days: Refreshes every 3600 seconds (1 hour)
- Over 30 days: Refreshes every 86400 seconds (1 day)

Passkey Response Time
The Latency graph helps evaluate LoginID's system performance. It displays response times for passkey authentication events:
- Passkey Registration Initiated: Time taken to generate and deliver the passkey creation prompt to the user’s device.
- Passkey Registrations: Total time to complete the passkey creation process, from prompt delivery to final confirmation.
- Passkey Authentication: Total time to complete the passkey login process, from prompt delivery to successful authentication.
Each stage is measured using:
- Minimum response time
- Median response time
- 95th percentile (slowest 5%) response time

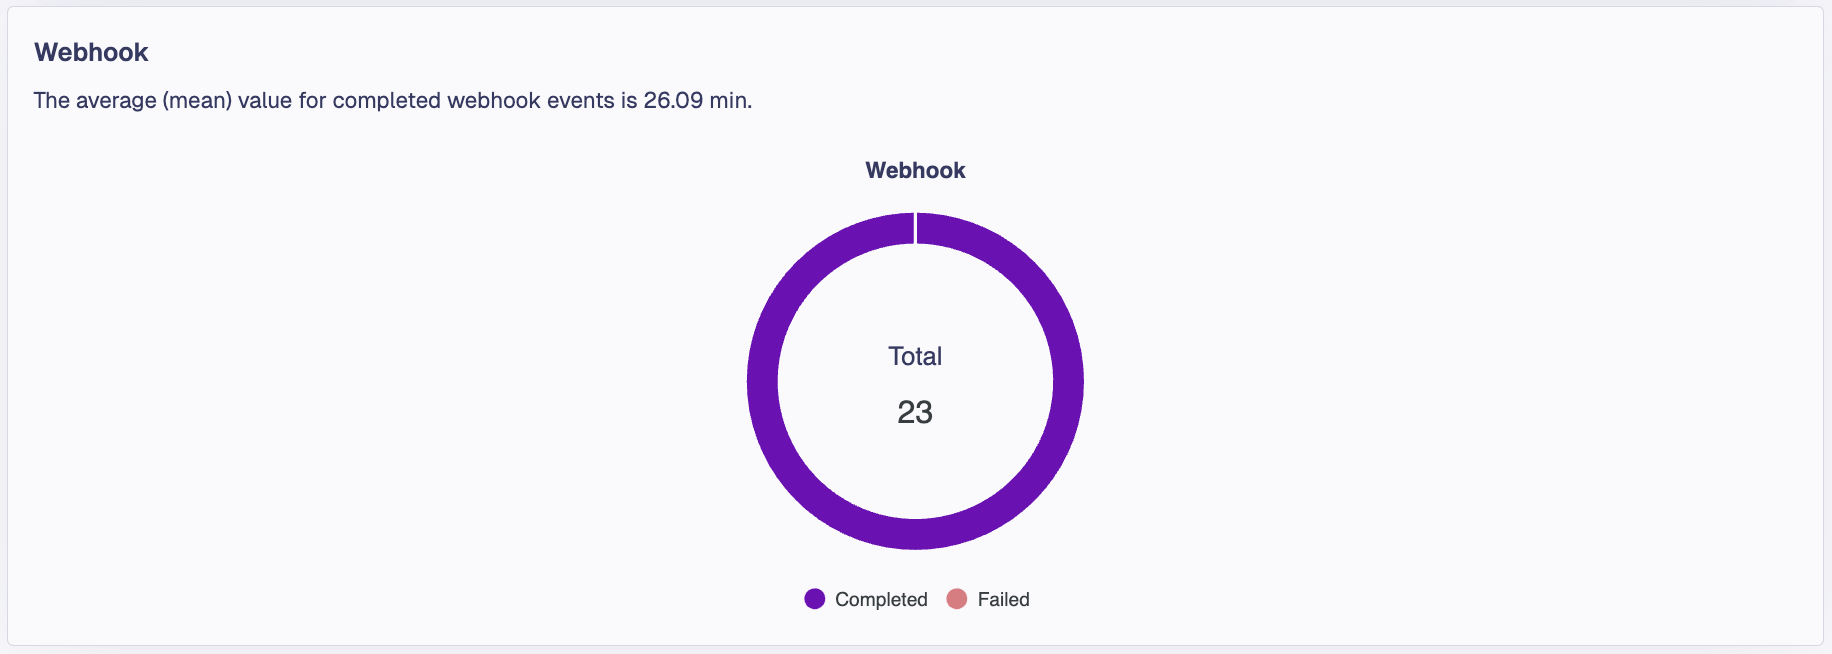
Webhook Events
A dedicated Webhook card summarizes identity‑verification webhook activity for the currently selected application and time range. It highlights the average (mean) processing time for completed events and visualizes outcomes in a donut chart.
It shows:
- Total webhook events for the selected period in this application
- Breakdown of Completed vs Failed events
- The average (mean) processing time for completed webhook events (displayed above the chart)
Use this view to quickly assess the health and responsiveness of your webhook integration. Spikes in failures or increases in the mean time indicate potential issues with your endpoint or upstream identity processing.
These webhooks are used to verify and approve identity as part of PasskeyID flows. For background and integration details, see the PasskeyID Overview and Integration guides: